Financial Review (2022–2023)
Harvey Mudd College, like other institutions, have faced and continue to grapple with challenges arising out of the COVID-19 pandemic, including managing increases in costs due to inflation. Despite these challenges, the College ended the fiscal year well with a strong financial position and positive operating results due to the continued support of trustees, alumni, parents and friends as well as favorable investment returns. The collaboration between leadership and the community fosters diversity and advances the College’s mission. With the arrival of HMC’s sixth President Harriet B. Nembhard, we look forward to continuing to provide the resources needed to support HMC’s outstanding educational experience.
Endowment Market Value
(In thousands)

$413 Million
JUNE 30, 2023
Statement of Activities
Revenue
| Category | 2023 | 2022 |
|---|---|---|
| Tuition, fees, room and board | $73,762 | $71,011 |
| Less financial aid | ($21,577) | ($20,375) |
| Net student revenues | $52,185 | $50,636 |
| Federal grants | $5,142 | $2,855 |
| Private gifts and grants | $19,091 | $14,762 |
| Private contracts | $1,729 | $2,096 |
| Endowment payout | $16,561 | $15,958 |
| Other revenue | $2,262 | $530 |
| Total Revenue | $96,970 | $86,837 |

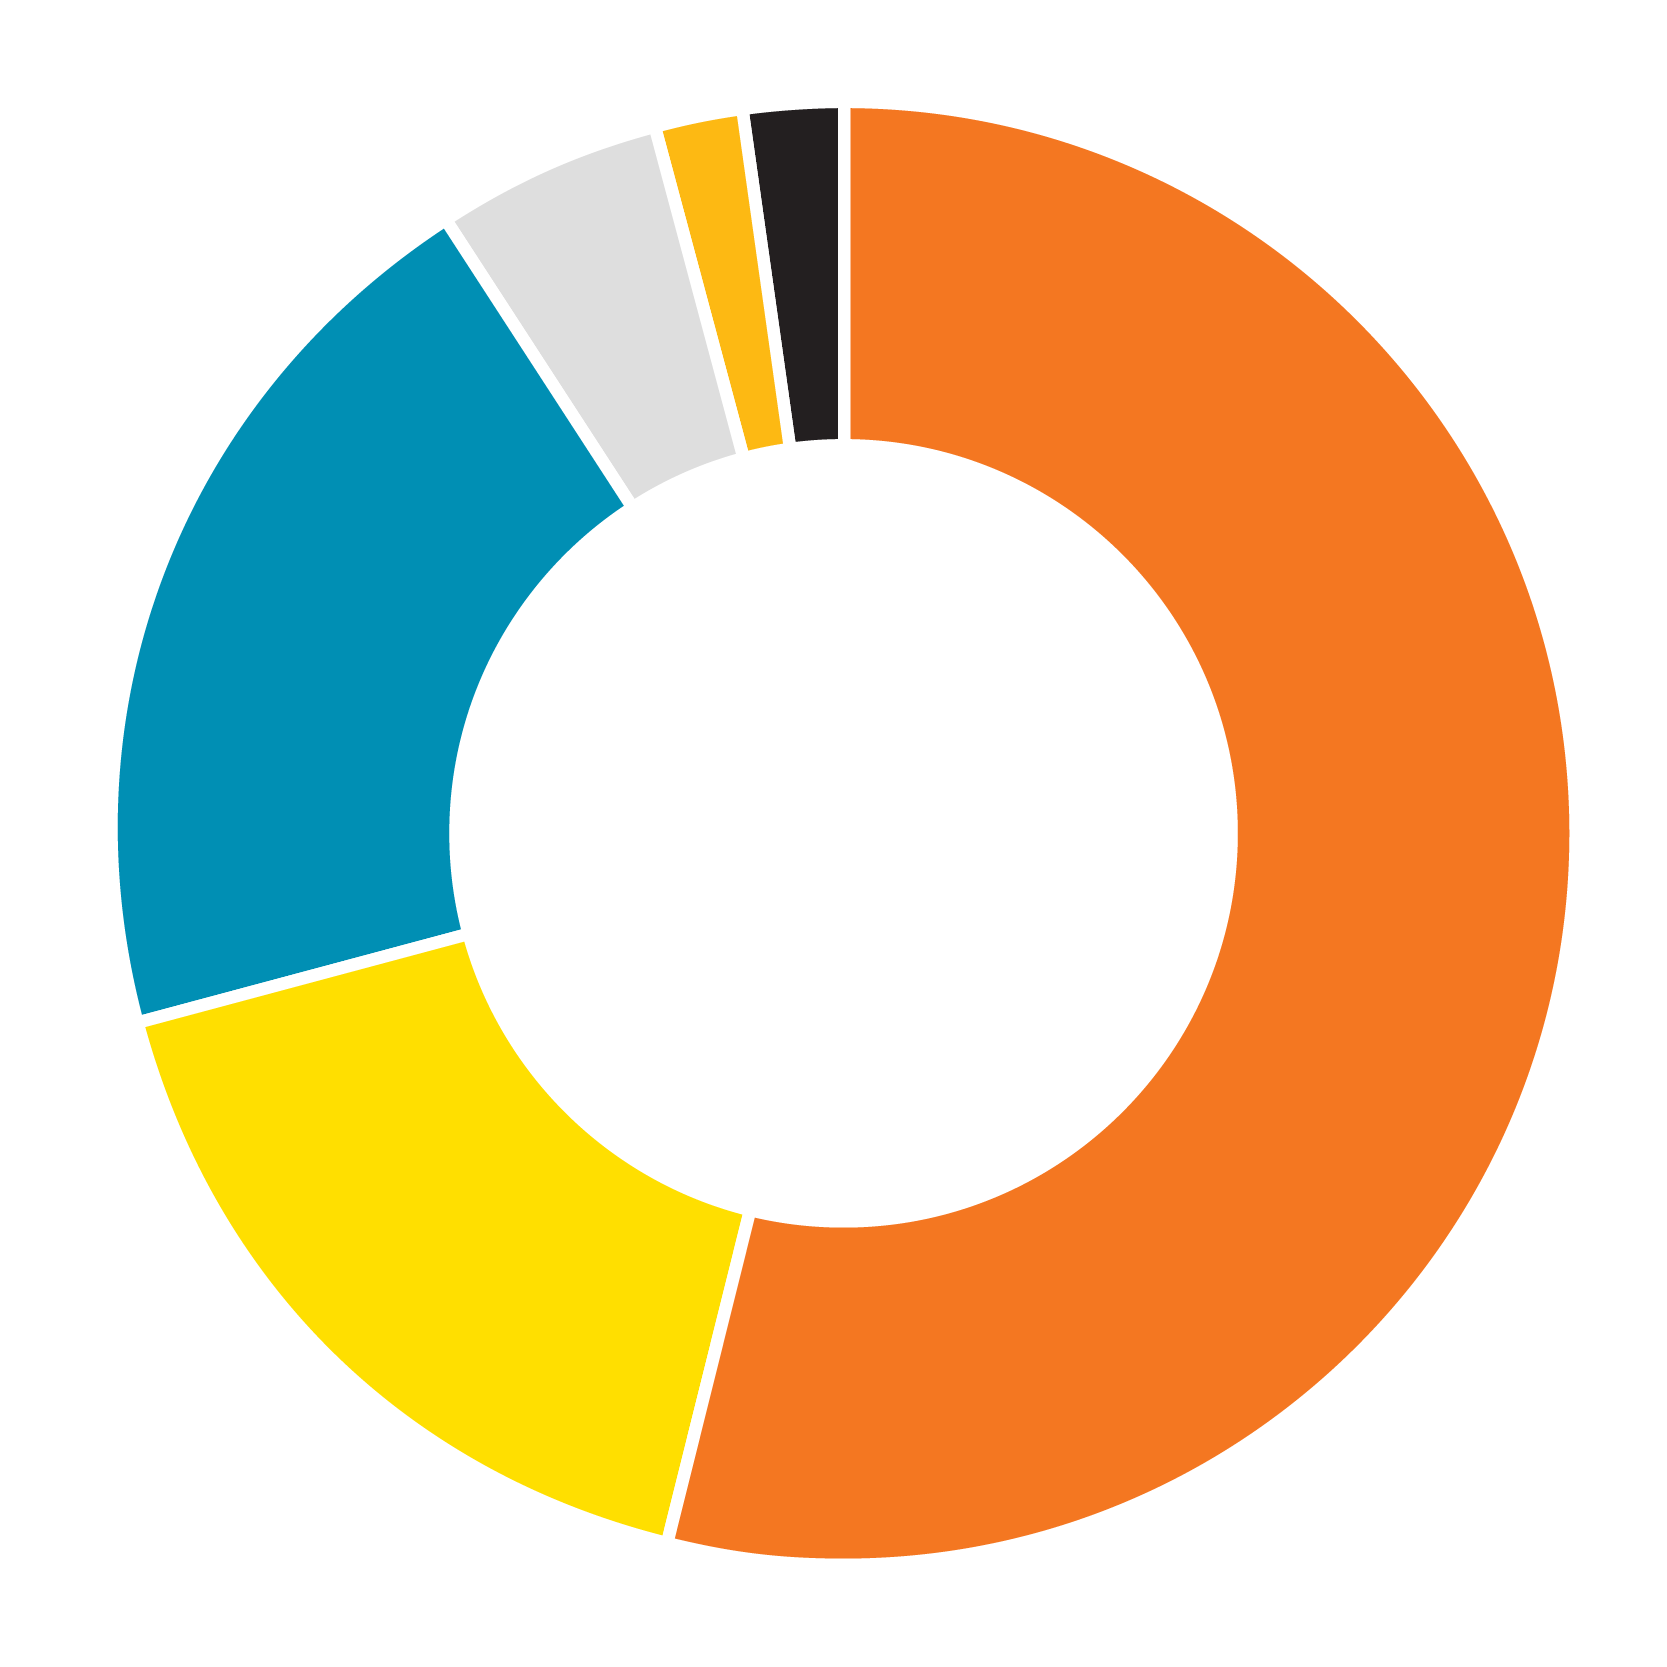
- Net student revenues, 54%
- Endowment payout, 17%
- Private gifts and grants, 20%
- Federal grants, 5%
- Private contracts, 2%
- Other revenue, 2%
Expenses
| Category | 2023 | 2022 |
|---|---|---|
| Instruction | $34,142 | $30,478 |
| Research | $4,366 | $4,156 |
| Public service | $785 | $756 |
| Academic support | $7,703 | $6,958 |
| Students services | $9,591 | $8,523 |
| Institutional support | $14,566 | $12,503 |
| Auxiliary enterprises | $12,993 | $12,428 |
| Total Expenses | $84,146 | 75,802 |
| Total Expenses | $84,146 | 75,802 |
|---|---|---|
| Excess revenue over expenses | $12,824 | $11,035 |
| Polled investment gains (losses), net of endowment payout | $1,835 | ($45,243) |
| Other changes in net assets | $471 | $9 |
| Change in net assets | $15,130 | ($34,199) |

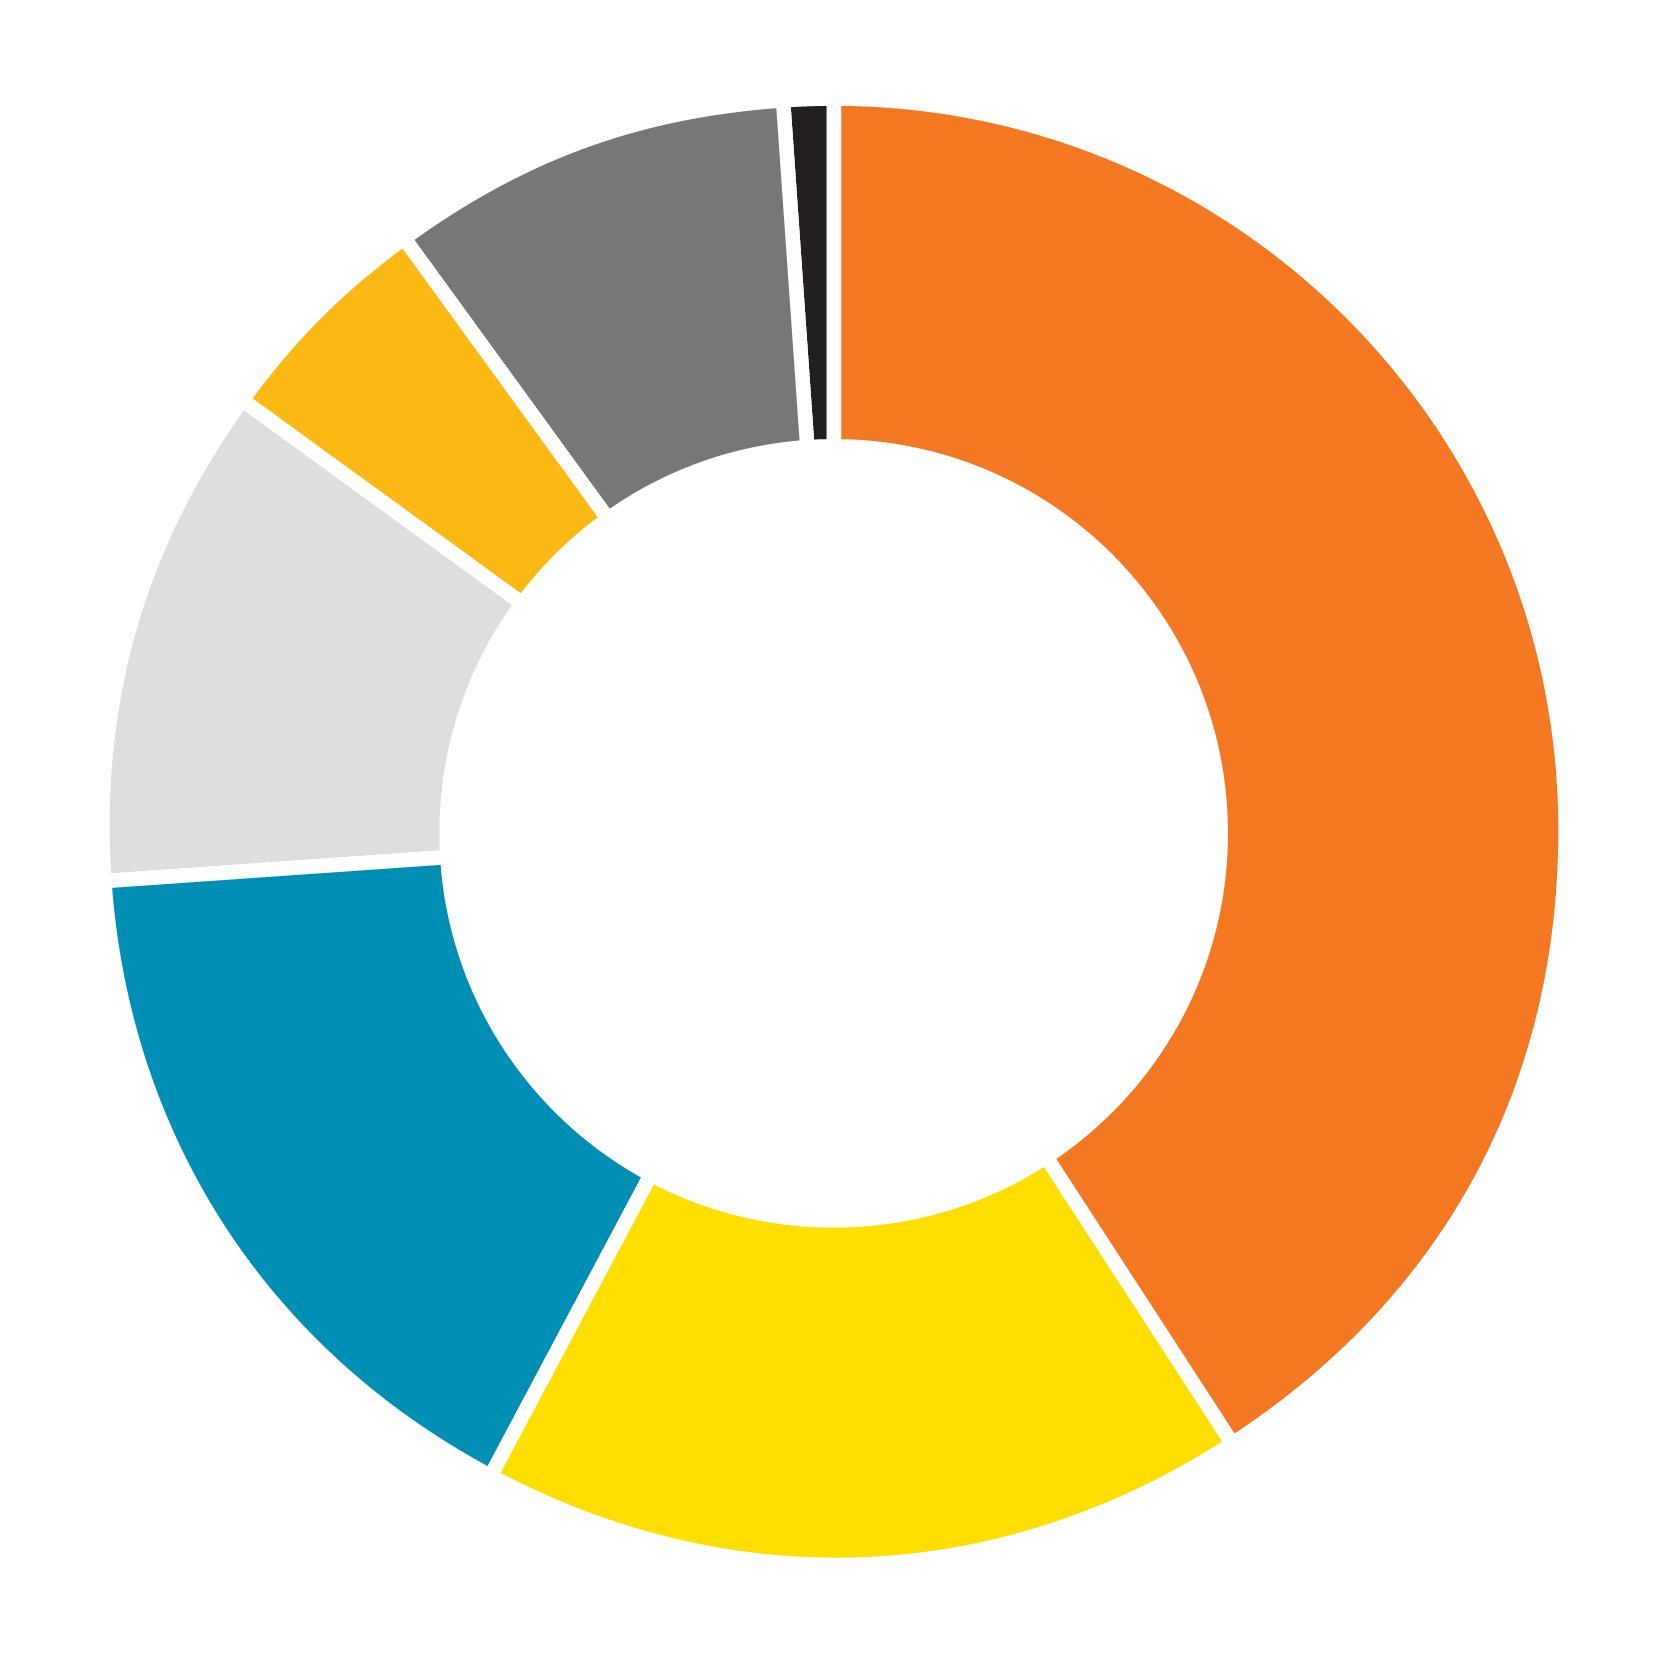
- Instruction, 41%
- Institutional support, 17%
- Auxiliary enterprises, 16%
- Student services, 11%
- Research, 5%
- Academic support, 9%
- Public service, 1%