WHAM Executive Summary
Student workload and mental health is a major concern to our community. Prior to fall 2017, the only available data on student workload came from end-of-course evaluations. This data was highly variable and only provided a single point-in-time estimate. The Workload and Health at Mudd (WHAM) study sought to collect more detailed data by asking about workload for each course at the end of each week throughout the fall semester of 2017. The WHAM study was designed to do three things:
- Gain a more accurate estimate of out-of-class workload for HMC students and establish to what extent it fluctuates over the course of a semester.
- Document the effort students are making to meet the expectations of the curriculum.
- Describe the impact that workload has on other aspects of student well-being and performance.
This summary focuses on the findings about the amount of time students report spending outside of class on classwork, highlighting the findings by groups, like race/ethnicity, gender and class year. The results reported here are based on 301 respondents who were enrolled at HMC in the fall semester of 2017, completed the demographics questionnaire and contributed at least one week of data. Visit the full participant demographics.
Time over the semester
Overall, respondents report averaging 27.2 hours per week on classwork outside of class1. On the one hand, that is well within the Carnegie unit recommendation of two hours out of class for every credit hour, or 24–36 hours per week. On the other hand, this is considerably more than the 12–15 hours per week the average college student spends studying. Beyond that, looking at the 27.2 figure in isolation would mean missing some important considerations. Assuming a full course load2, students are spending approximately 45 hours per week either in class or on classwork—more than is required at a full-time job. Adding in the cognitive effort of engaging with five to seven different courses and faculty along with other co- and extra- curricular obligations that require both time and energy, and it is possible to see how this contributes to an overall feeling of overwhelm, especially over the course of the semester.
| Year | Average HPW outside of class | Average Units3 | Total hours on academic activities4 |
|---|---|---|---|
| First | 24.04 | 17 | 44.04 |
| Sophomore | 27.83 | 17 | 48.83 |
| Junior | 28.96 | 16 | 44.96 |
| Senior | 27.95 | 16 | 43.95 |
| All | 27.2 | 16.5 | 45.45 |
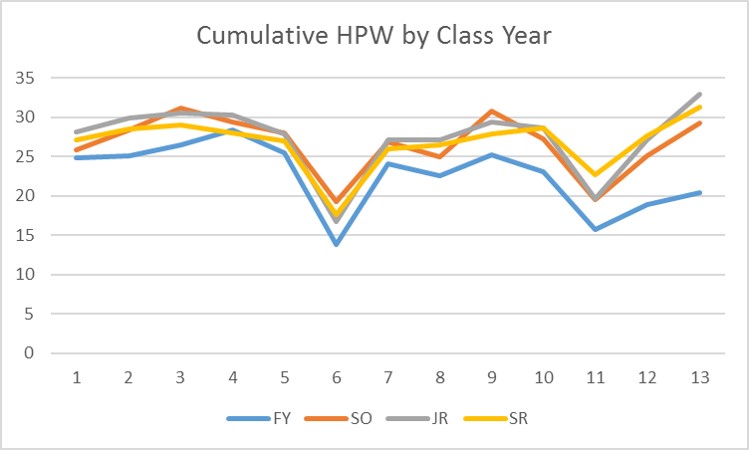
Looking over the course of the semester, the weeks of October break and Thanksgiving break, as expected, show a considerably reduced out-of-class workload—out-of-class workload averages roughly 10 hours less than regular week (16.7 hours during October break and 19.2 hours during Thanksgiving break). Nonetheless, even during these shortened weeks, respondents still report considerable out-of-class work expectations.
It is also clear that other than those two breaks, out-of-class workload is fairly stable. By week three of the semester (the first week of the study) respondents report spending, on average, 26.5 hours outside of class on classwork and, while overall out-of-class workload averages range from a high of 29.2 hours and a low of 24.3 hours, there is less variation over the semester than might be expected.
Hours per week by class year
When looking at the results disaggregated by class year, it appears that the hours per week follow a consistent pattern for all class years, with two distinct dips for October break and Thanksgiving. There is also a sharp increase toward the end of the semester, which is most pronounced for juniors and seniors, likely due to Clinic or thesis. First-year respondents report spending slightly fewer hours on average (24.0) than sophomores (27.8), juniors (29.0) or seniors (28.0).

Hours per week for men and for women
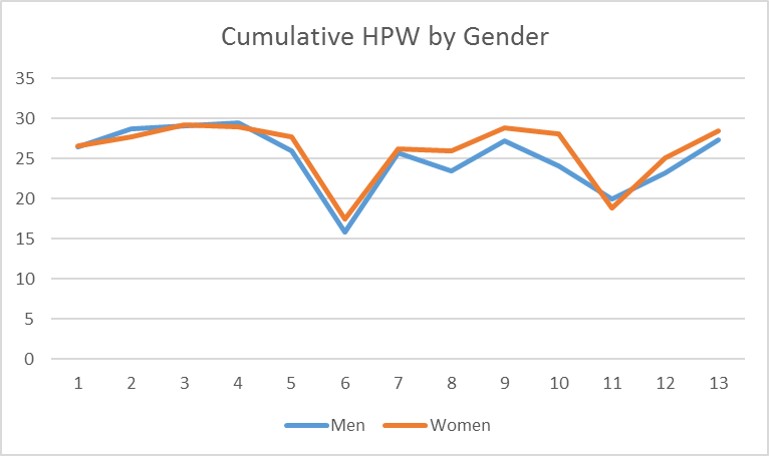
There is a small but consistent gap between men and women in the amount of time they report spending outside of class on coursework. Women respondents report spending 27.5 hours per week, while men average 26.4. Women report spending slightly more hours outside of class in all but two weeks (week two of the study and the week of Thanksgiving break), and the largest differences between men and women occurred in the middle of the semester (weeks 8 and 10).

Hours per week by race/ethnicity
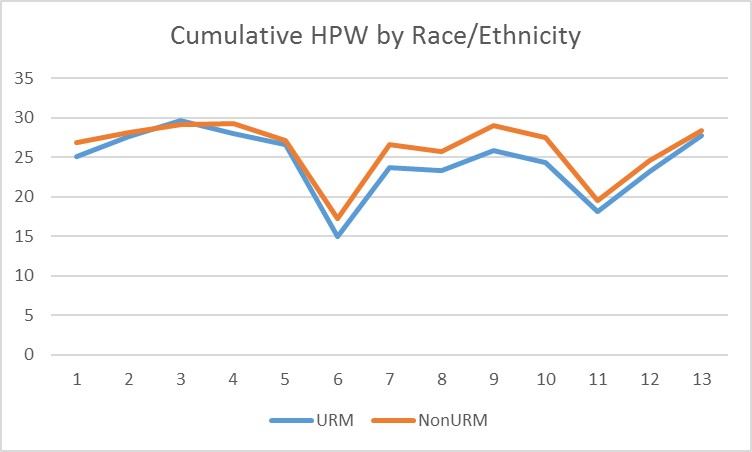
There also is a small difference regarding time spent outside of class on coursework between respondents who are underrepresented in STEM fields (visit FAQs for more information) and those who are not. The underrepresented in STEM respondents (URM) report spending 25.9 hours per week, while respondents who are not traditionally underrepresented (non-URM) average 27.5. URM respondents report spending slightly fewer hours outside of class in all but week three, when the two groups are virtually identical (29.7 hours for URM respondents and 29.1 for non-URM respondents). The largest differences between URM and non-URM students occurs in the middle of the semester (weeks nine and 10), but there is a stable gap starting in week seven that persists through Thanksgiving Break (week 11).

Footnotes
- Excluding weeks of October break and Thanksgiving break ↵
- Carnegie assumes one hour of instruction per unit for lecture courses and three hours of instruction per unit for labs ↵
- Based on sample HMC schedules in the HMC Catalog, pages 30–31. ↵
- For FY and SO we used the default schedules in the HMC Catalog, pages 30–31 to calculate in-class time. JR and SR units are estimates and assume hours of in-class time are equivalent to units. This estimate under-represents the truth for some and over-represents for others. ↵